Passing Rate Tool
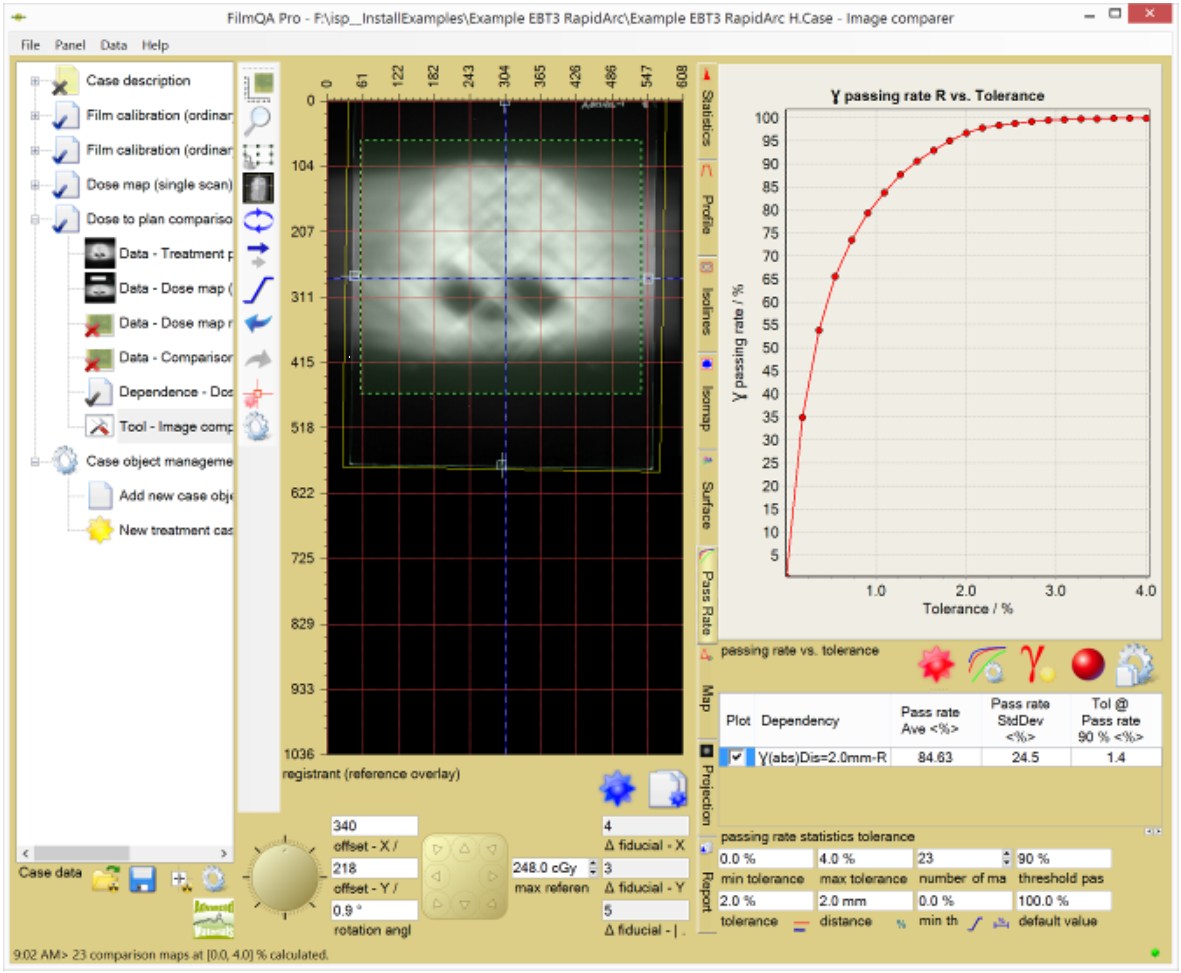
Investigative tool to explore dependencies of the comparison passing rates with respect to comparison map parameters, signal noise and image resolution. Dependency of the achieved passing rate with respect to test parameters to estimate how reliable the results of the Gamma analysis are.
For example, a Passing rate vs Tolerance chart provides much better understanding of the achieved Gamma map deviations than a single Gamma passing rate at a specific Gamma tolerance as shown below.
Use the  button or right click the chart area to configure chart settings.
The following comparison values can be plotted:
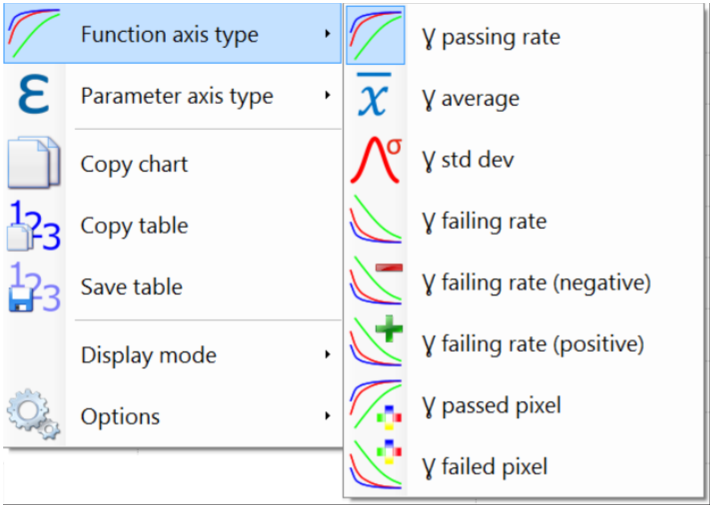
- Passing rate: Ratio between number of pixels that passed the test criterion and total number of tested pixels.
- Average: Average of the comparison map values.
- Std dev: Standard deviation of the comparison map values.
- Failing rate: Ratio between number of pixels that failed the test criterion and total number of tested pixels. Failing rate = 100% - passing rate.
- Failing rate (negative): Ratio between number of failed pixels with value below the reference and total number of tested pixels.
- Failing rate (positive): Ratio between number of failed pixels with value above the reference and total number of tested pixels.
- Passed pixels: Number of pixels that passed the test criterion.
- Failed pixels: Number of pixels that failed the test criterion. Failed pixels = total number of tested pixels - passed pixels.
The above comparison values can be plotted against the following parameters:
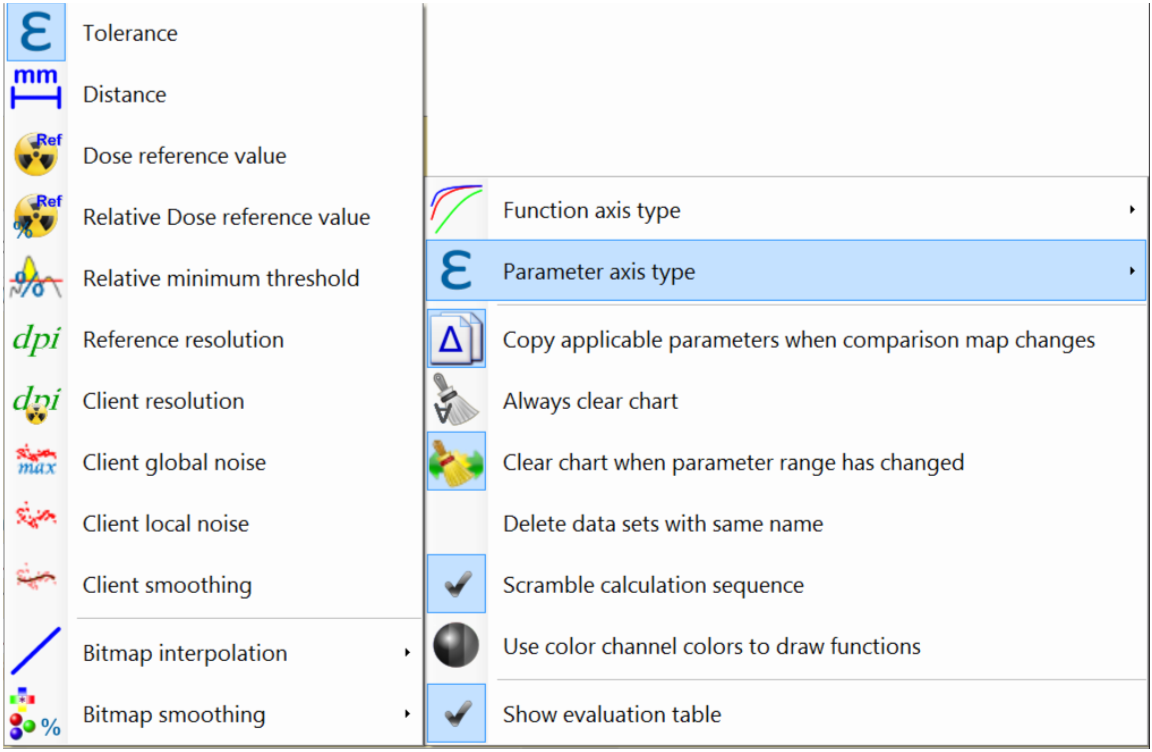
- Tolerance: Test tolerance of the comparison used to let a specific pixel pass or fail.
- Distance: Test distance for comparison maps that uses ‘Distance to agreement’ search. Only available for comparison maps with such search (e.g. not available for differential delta comparison).
- Dose reference value: Value clusters (dose range) of the reference image (plan) are analyzed separately. The size of the value clusters can be chosen as percentage of total range. Right click parameter range input box to assign relative value range as shown below.

- Relative dose reference value: Value clusters (dose range) of the reference image (plan) raltive to the total range are analyzed separately. Right click parameter range input box to assign relative value range as shown above.
- Relative minimum threshold: Relative minimum threshold to exclude lower dose values from the comparison.
- Reference resolution: Resolution of the reference image (plan).
- Client resolution: Resolution of the client image (dose map). Note most comparisons in FilmQA Pro use the projection of the client image to the grid of the reference image (plan) to reduce the dependency on noise—see Gamma Analysis.
- Client absolute noise: Varies the noise added to the client image (dose map). The added noise is equi-distributed in a range proportional to the maximum value (global or absolute).
- Client relative noise: Varies the noise added to the client image (dose map). The added noise is equi-distributed in a range proportional to the local client value (local or relative).
- Client smoothing: Varies the smoothing of the client image (dose map) using a convolution filter that can be selected at “Client smoothing”. Additional concolution filters can be defined in the image viwer and editor tool.
The following options can be selected to control how the chart is updated:
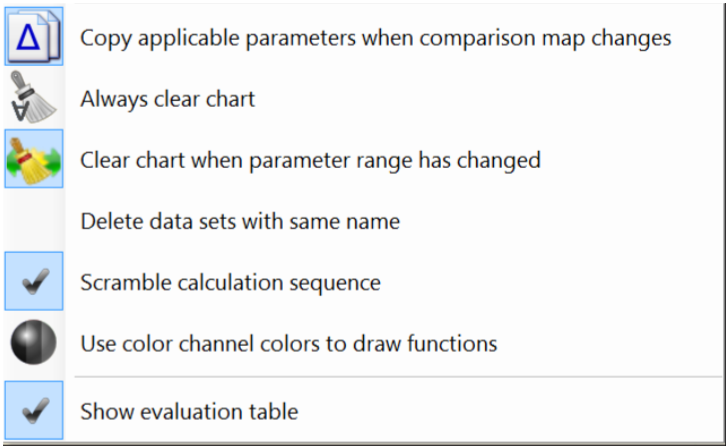
- Copy applicable parameters ...: When selected all parameters the new and the previous comparison map have in common are copied to the new selection.
- Always clear chart: Chart is always cleared before new function is plotted (only single function shown).
- Clear chart when parameter range has changed: When parameter range for x axis changes the chart is cleard (only function across same range are plotted).
- Delete data sets with same name: If selected existing functions with same name are deleted from plot when new function is added.
- Use color channel colors to draw function: If selected each function is plotted with the color of the corresponding color channel.
- Show evaluation table: If selected a table with function statistics and threshold parameter is shown.