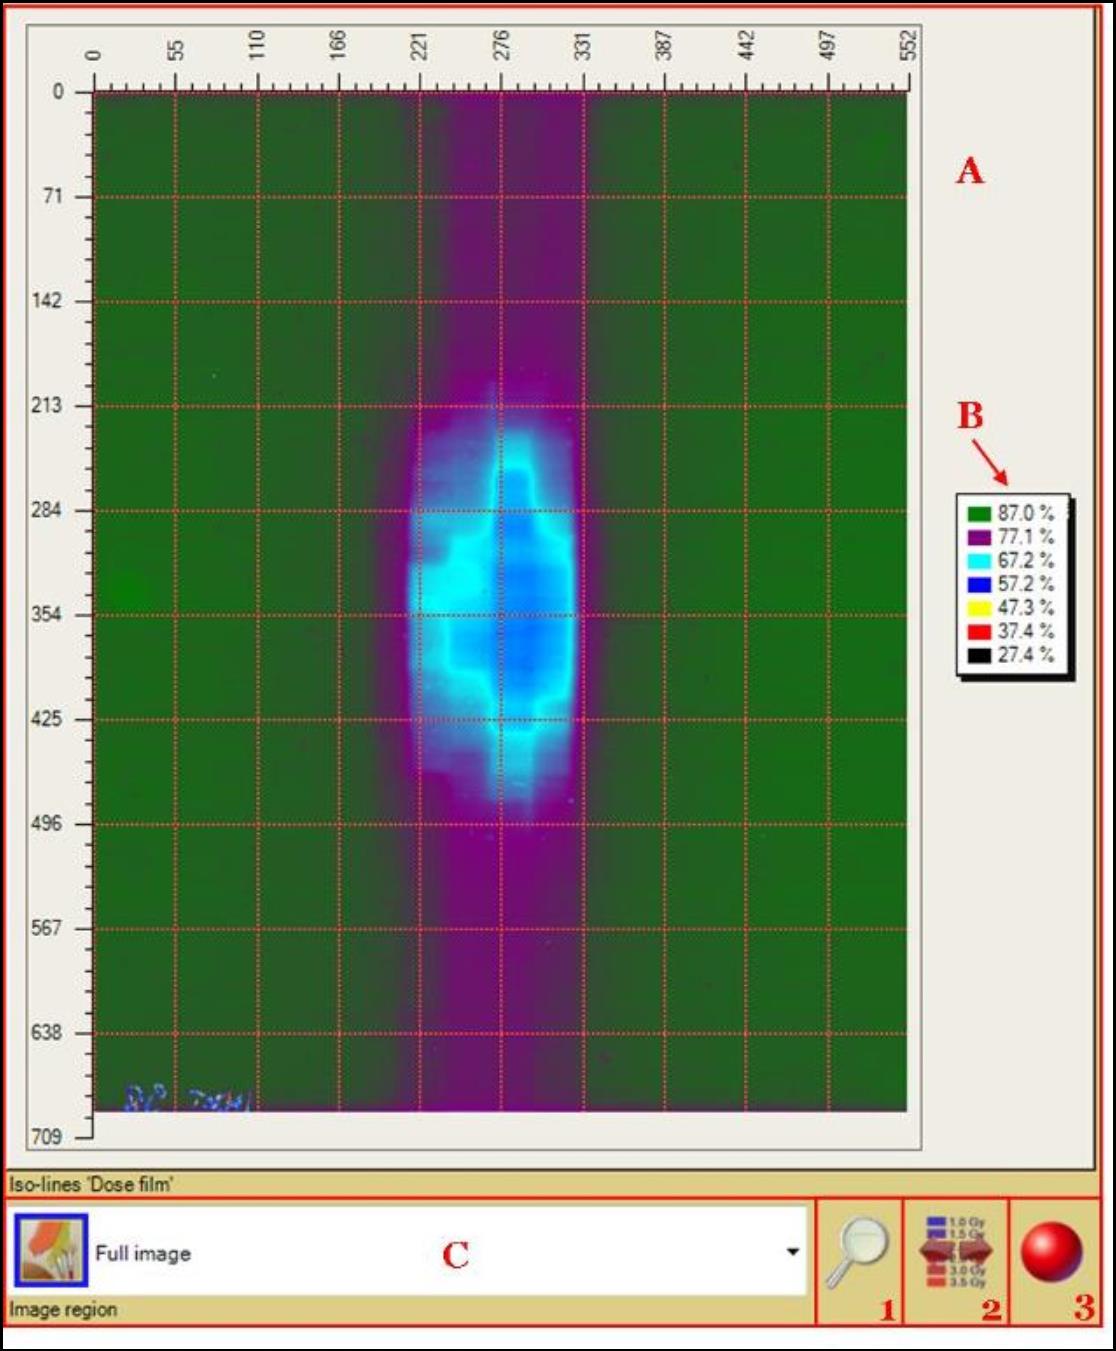
The Iso-map Panel is one of the sub-panels of “Film Evaluation Panel.” Click on the last tab to access the “Iso-map Panel.” It displays dose map or color channel map of the image in the “Image Panel” for a given set of dose or color channel values.
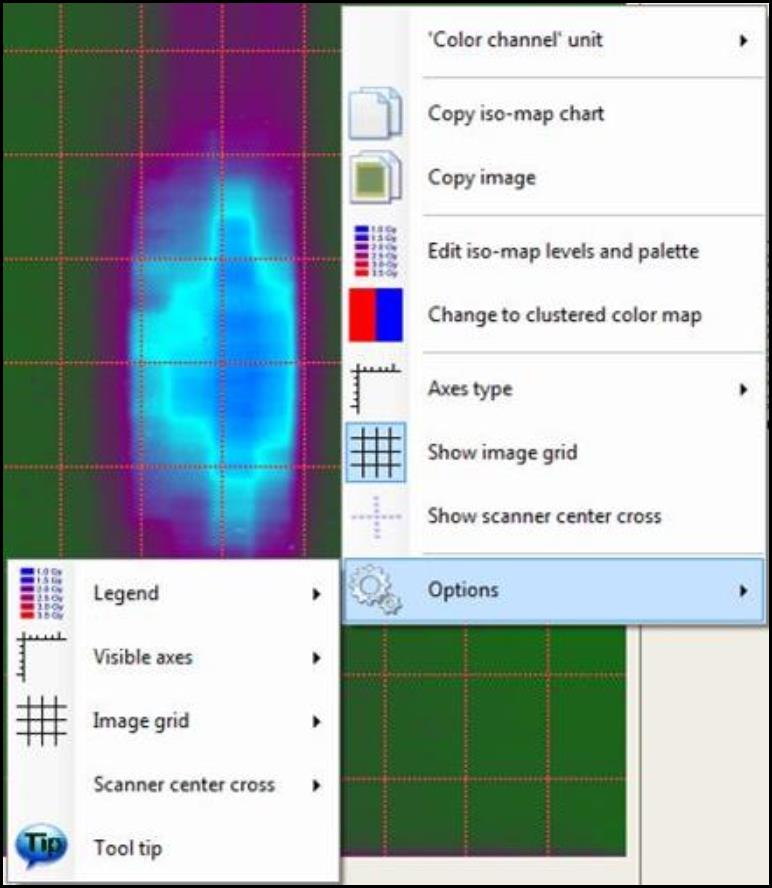
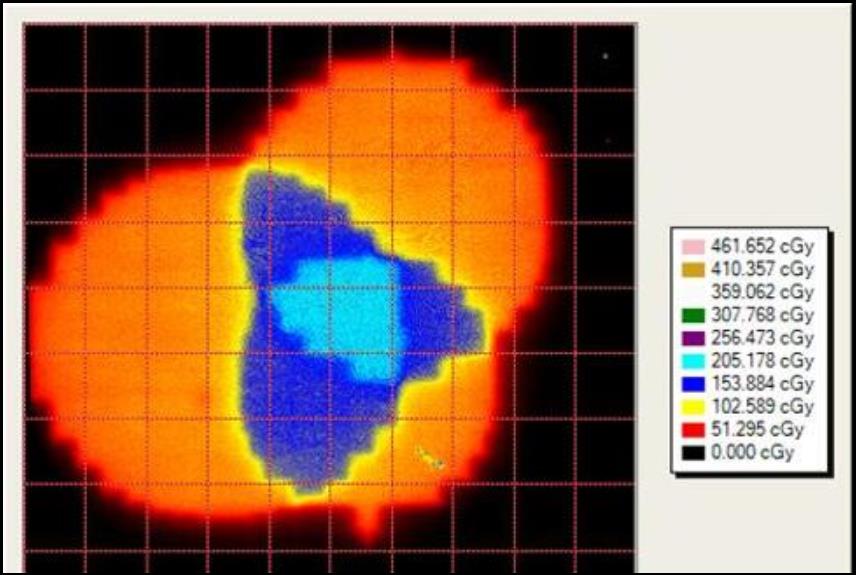
“Iso-map Chart” shows the map for dose or color channel for the image opened in the “Image Panel.” Right click inside the chart to copy and to change the configuration of the chart.
Under “Case Data Selector,” double click on “Dose map from image (single scan)” and select
“Data – Dose film” to see color channel map of the image.
“Data – Dose map (read only)” to view the dose map of the image.
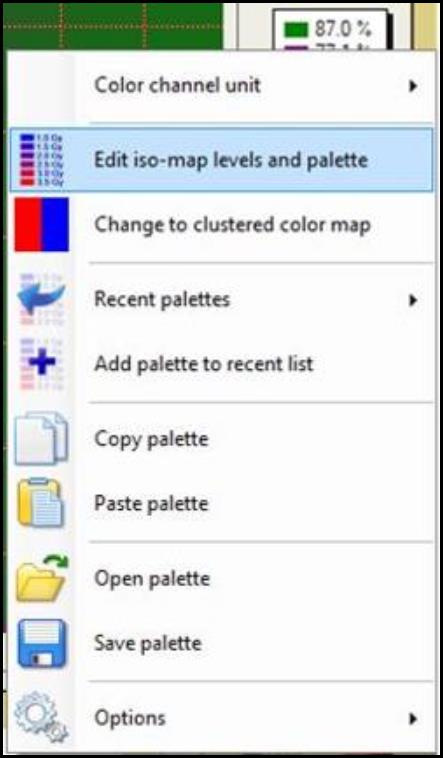
The “Legend” selection feature displays the color palette associated with different dose or color channel values. Right click inside the box to change the unit or location of the legend as well as add, copy, paste, open, and save the palette.
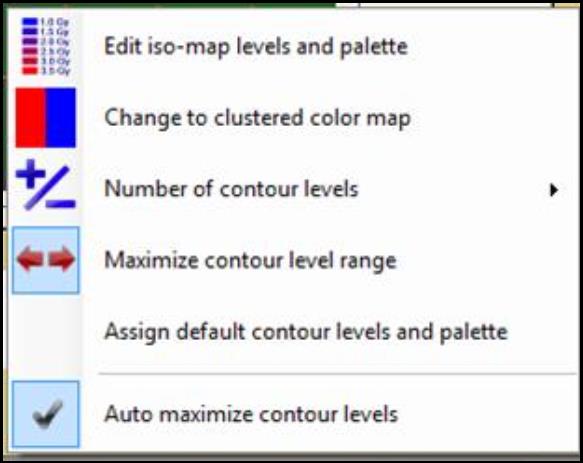
Select “Edit iso-map levels and palette” to open “Iso-Map Levels” window.
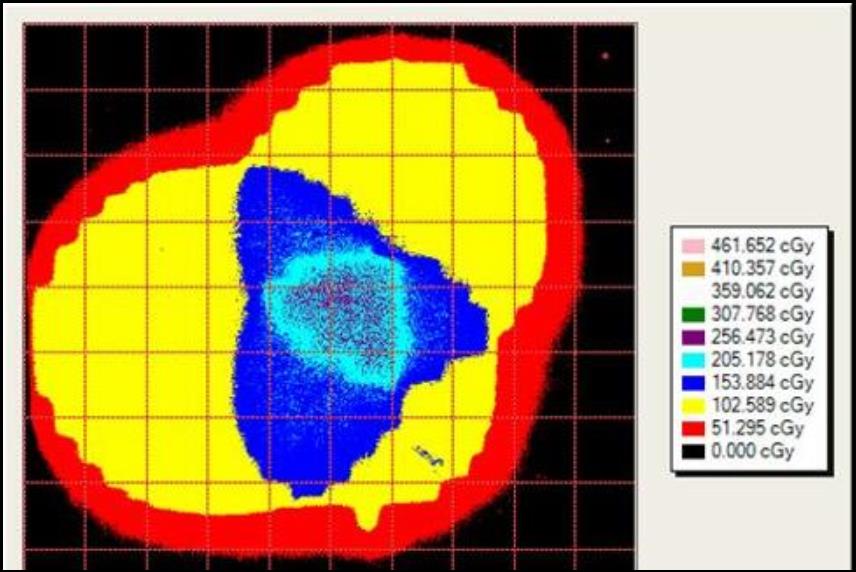
Select “Change to clustered color map” to display the map as a discrete color distribution:
Select “Change to continuous color map” to display the map as a continuous color distribution:
“Image region” drop-down list allows you to select the region of image displayed in “Iso-map Chart,” A.
“Magnifier tool” allows you to fit or zoom in and out of the image.
The “Contour Level Settings” button allows you to select contour levels and palette to generate the map. Click on the button and
Select “Number of contour levels” to change the number of isodose levels or color channel values in the contour plot.
Select “Maximize contour level range” to set range to the minimum and maximum color channel values or doses in the chart of the image opened in the “Image Panel.”
Select “Auto maximize contour levels” to maximize the range automatically when opening a new image in the “Image Panel.”
“Color channels” button allows you to select the color channels to calculate the iso-map data. Click on the button and check “Show pixel value” to enable the display of color channel map when “Data – Dose map (read only)” is selected under “Case Data Selector.”