Charts Panel
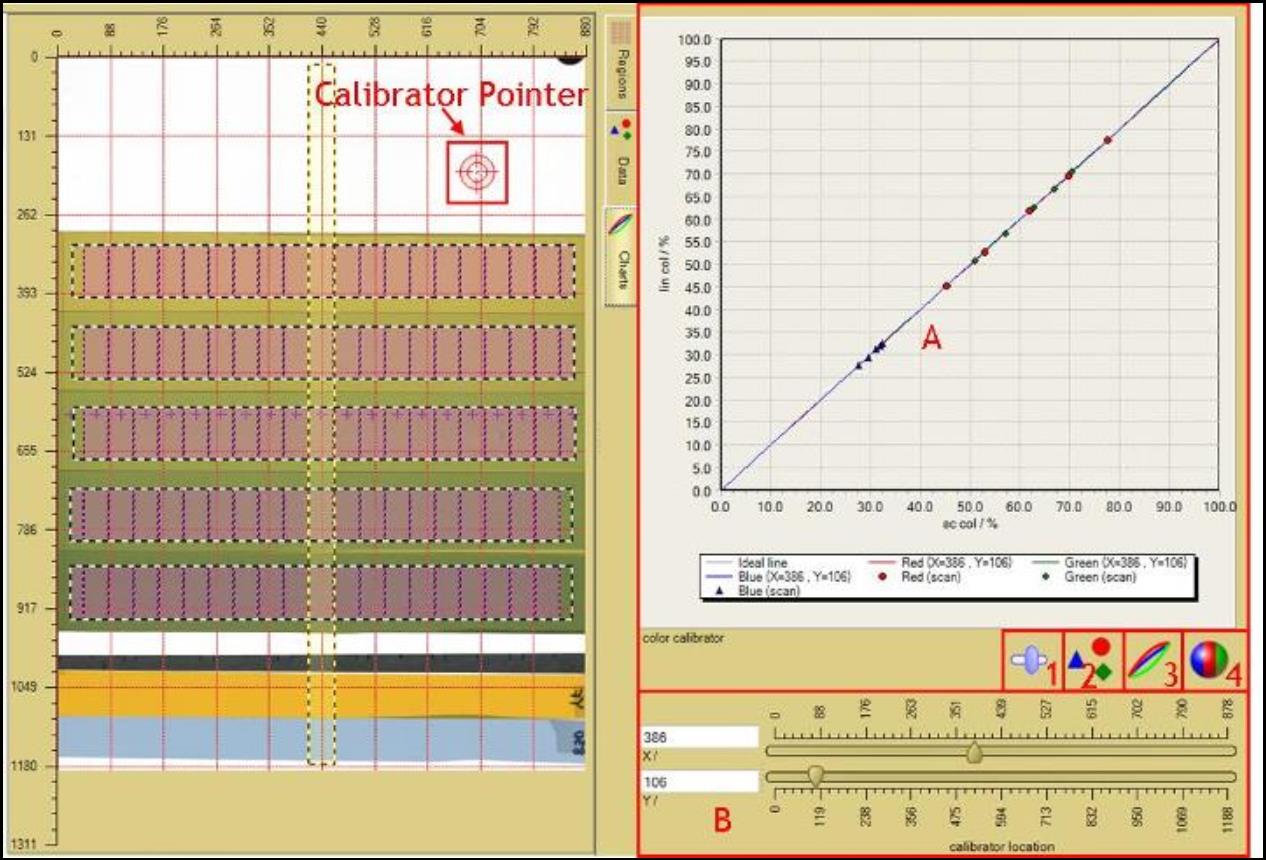
The Charts Panel allows you to chart the various dependences of the scanner characterization curve S as described in “Scanner Linearization Panel.” The calibrators are interpolated so that any scanner points are available.
1. The “Track bar tools” allows you to show or hide all the sliding bars as shown in box B in the “Charts Panel.”
2. The “Calibrator color data range” button allows the program to widen the search range of calibrator color data displayed in the “color calibrator” chart, A, e.g., select value n to allow the program to look for data at index +/- n.
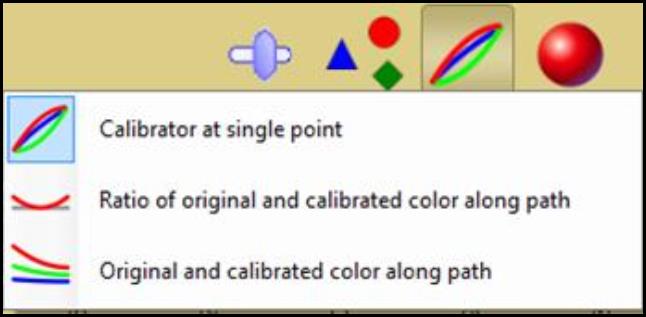
3. The “Color calibrator charting mode” button allows you to select the calibrator dependence shown in the “color calibrator” chart, A.
- “Calibrator at single point” allows you to view the “Linearized Color Value vs. Scanned Color Value” chart which displays the scanner characterizing function, S, as described in the “Scanner Linearization Panel,” at the point selected in the “Image Panel” using the “Calibrator Pointer” as shown in the image above.
- “Ratio of original and calibrated color along path” displays the chart as “Color Ratio vs. Image Path.” The color ratio is defined as the ratio between scanned image pixel value and the corrected pixel value along a selected image path. Click and drag in the “Image Panel” to create an image path.
- “Original and calibrated color along path” displays the chart for “Color Value vs. Image Path” for the path created in the “Image Panel.”
4. The “color channels” button allows you to select the color channels of the calibration data displayed in the “color calibrator” chart, A. Click or unclick the preferred color channels to view or hide them on the chart.
- Select “Single color channel only” to allow only one color channel selection at a time.
A. The “color calibrator” chart displays different information depending on the color calibrator charting mode selected under button 3.
- To zoom in, click and drag a region from top left to bottom right of the preferred region. To unzoom, click and drag from bottom right to top left.
- Right click and drag to move the line chart to another location.
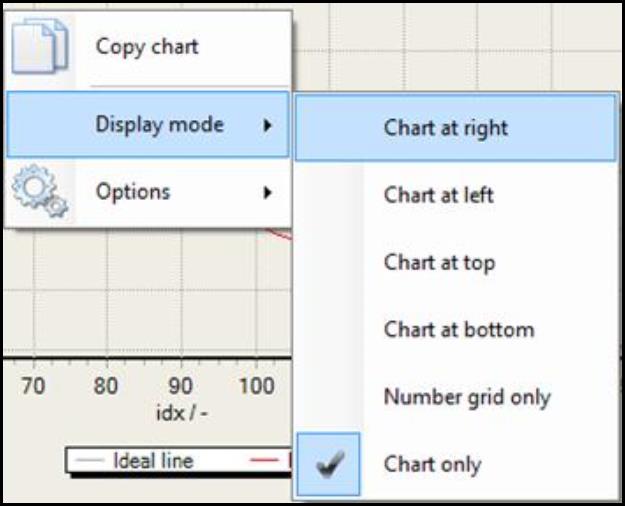
- Right click inside the chart then select “Display mode” to view the data table at the preferred location. The data table displays the data points which constitute the chart.
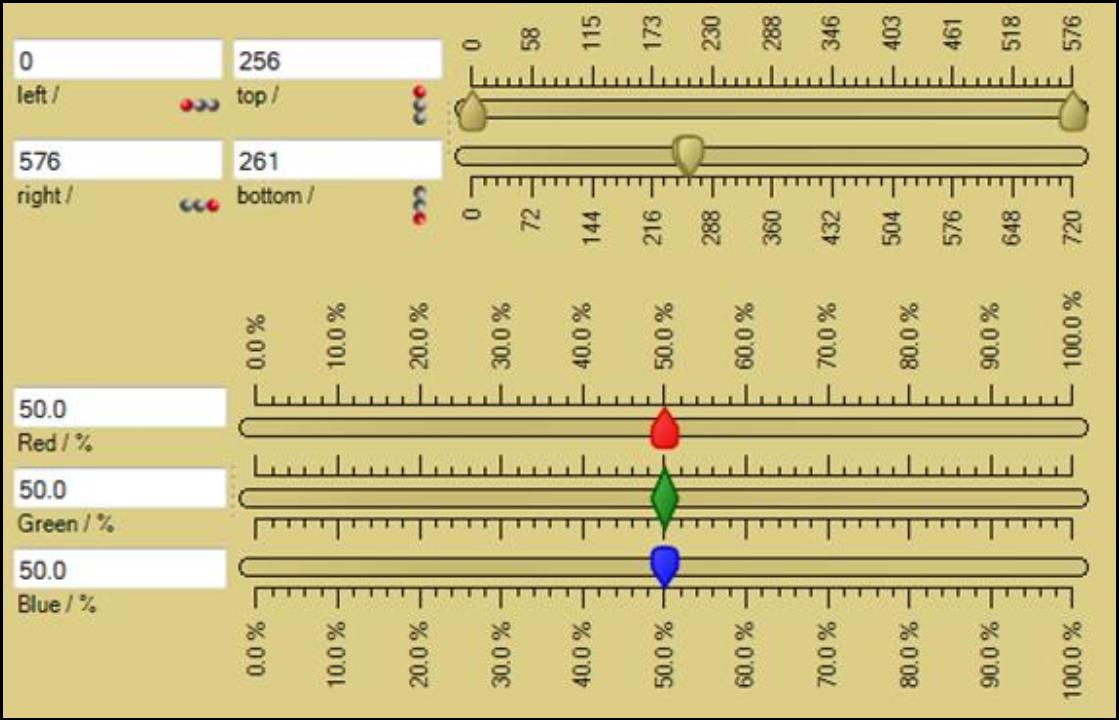
B. The “calibrator location” sliding bar allows you to change the location of calibrator pointer or image path in the “Image Panel.”
- When “calibrator at single point” is selected under “Color calibrator charting mode” button, 3, the sliding bars allow you to change the x and y location of the “Calibrator Point” in the “Image Panel.”
- When “Ratio of original and calibrated color along path” is selected, the sliding bars allow you to change the location of the image path drawn in the “Image Panel” as well as changing the percentage of the color channel value, which allows you to check the entire color range used by the film.
- When “Original and calibrated color along path” is selected, the sliding bars allow you to change the location of the image path drawn in the “Image Panel.”